
RFID Event Revenue Impact
How RFID Wristbands Lift Event Revenue

Quick answer
Do RFID wristbands really lift event revenue? Named-source benchmarks say 15-30% per-capita spend (Glownet up to 30%, Tappit 22%), driven by 1-2 second tap payments versus 15-30 seconds of cash handling. This guide adds what vendors leave out: a worked ROI model for a 10,000-attendee festival, which parts of the lift repeat year-over-year, and the five failure modes that erase it.
- 15-30% per-capita spend lift, with named provenance: Glownet reports up to 30% higher revenue per guest across its festival base; Tappit cites a 22% average takings increase. Both are defensible in a budget meeting - the table below shows exactly what each number rests on.
- The mechanism is throughput arithmetic, not magic. A cash transaction costs 15-30 seconds of bartender time; a wristband tap takes 1-2 seconds. At peak, that difference converts directly into orders served per lane - and every unserved order walks to the next bar or back to the stage.
- Band cost is noise in the business case. At $0.50-1.50 per wristband, outfitting 10,000 attendees costs less than 1% of even the most conservative incremental-spend estimate - which is why the serious diligence questions are about top-up infrastructure, refunds and staffing, not the band price.
At a glance
Use these short answers to decide whether this page matches the project before moving into the detail.
Key takeaway
15-30% per-capita spend lift, with named provenance: Glownet reports up to 30% higher revenue per guest across its festival base; Tappit cites a 22% average takings increase. Both are defensible in a budget meeting - the table below shows exactly what each number rests on.
The headline numbers - and where each one comes from
Vendor claims travel around the industry stripped of their sources. Here are the three most-cited figures with their provenance intact, so you can defend them when someo...
Next step
Ready to move forward? Start your inquiry to get specific answers for this project.
Plan your RFID cashless eventThe headline numbers - and where each one comes from
Vendor claims travel around the industry stripped of their sources. Here are the three most-cited figures with their provenance intact, so you can defend them when someone in the budget meeting asks where the 30% went.
- Treat the spread honestly: 15% is the number that survives a CFO review, 30% is what the best-run programs achieve with strong pre-load promotion and enough tap lanes.
- Every credible figure compares RFID cashless against cash-or-card baselines at the SAME event - cross-event comparisons conflate lineup and weather effects.
| Source | Claim | What it rests on | How to defend it |
|---|---|---|---|
| Intellitix | 15-30% increase in per-capita spending | Internal study across RFID-enabled events; friction reduction plus pre-load behavior | Ask for the deployment-level breakdown behind the range; treat 15% as the planning floor |
| Glownet | Up to 30% higher revenue per guest | Published data across its festival client base | Best-case, not median - model your P&L at the floor, not the ceiling |
| Tappit | 22% average increase in event takings | Post-rollout results at festivals including named UK events | A mid-range planning number; sits between the Intellitix floor and Glownet ceiling |
Four mechanisms - and the queue math behind the biggest one
None of the lift is magic. It comes from four ordinary mechanisms, each shaving resistance off the act of buying. One of them - queue conversion - is pure arithmetic you can verify with a stopwatch.
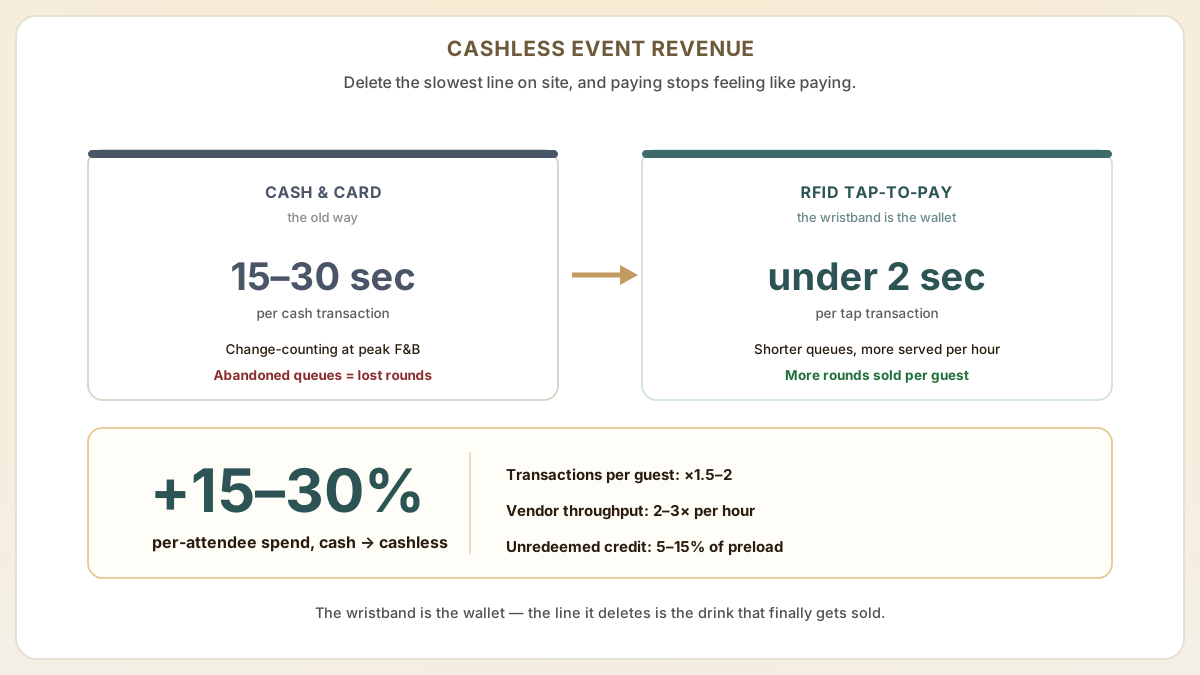
Stand at any festival bar during a headline set and time it: a cash order runs 15-30 seconds end to end (count change from a damp fold of notes, card terminals time out, someone needs a receipt). A wristband tap completes in 1-2 seconds. The payment step stops being the bottleneck - pouring becomes it - so a lane that served roughly 150 orders an hour on cash serves several hundred once tapping, limited by drink prep rather than by fumbling for wallets.
Worked example with stated assumptions: one bar lane doing 150 orders/hour on cash at a $12 average order turns $1,800/hour. If tap payments double peak throughput to 300 orders/hour - conservative, since pouring caps it well below the theoretical payment-step limit - the lane turns $3,600/hour. Two extra hours of headline-set peak therefore carries about $3,600 of otherwise-lost sales per lane. Multiply by your lane count and you have the core of the case.
- Friction removal: no wallet decision, no change counting, no declined-card embarrassment - small resistances that each suppress a sale disappear together.
- Impulse capture: the band is already on the wrist; the 'do I really want to pull out my wallet again' moment never happens, which is why transactions per attendee rise 1.5-2x.
- Pre-load commitment: attendees who load credits have pre-spent the decision; the money is psychologically already gone.
- Live analytics: organizers see spend by zone, vendor and hour while the event is still running - shifting staff and stock toward what's selling is itself a revenue action.
A worked ROI model for a 10,000-attendee festival
Vendors sell the lift and skip the ledger. Here is the whole arithmetic for a mid-size festival, using only the benchmarked lift range and published band pricing - drop in your own baseline spend and quotes.
Two honesty notes on this model. First, incremental GROSS spend is not profit: vendor margins apply, and the payment platform takes its fee. Second, the reader/software line is deliberately absent because quotes vary wildly by vendor and event shape - collect three, and make sure offline-mode behavior is in writing (see failure modes below).
| Line item | Basis | Conservative (15%) | Strong (25%) |
|---|---|---|---|
| Baseline cashless spend | 10,000 attendees x $40/day assumed | $400,000 | $400,000 |
| Incremental gross spend | baseline x lift | $60,000 | $100,000 |
| Wristband outlay | 10,000 x $0.50-1.50 (Tyvek/silicone mix) | $5,000-$15,000 | $5,000-$15,000 |
| Breakage credit | unredeemed pre-load, 5-15% of loaded value | adds margin, not cost | adds margin, not cost |
| Band outlay as % of uplift | outlay / incremental | 8-25% | 5-15% |
Which parts of the lift repeat - and which decay
The 15-30% number is a blend of durable mechanisms and one-off effects. Buyers who model year two on year-one headlines get burned; here is the split.
Repeats year-over-year
- Queue conversion at bars and gates - physics, not novelty
- Impulse capture from always-worn credentials
- Zone/vendor analytics improving ops decisions each edition
- Fraud and counterfeit-ticket reduction on tapped entry
Decays after year one
- Pre-load breakage windfalls - regulars learn to load exact amounts
- First-year novelty spending by early adopters
- Press-coverage halo effects around going cashless
- Model steady-state at the floor of the lift range (15%) and treat anything above as upside - that is how the number survives its second budget meeting.
- Breakage deserves its own policy: some jurisdictions and platforms require refunding unspent balances; factor the admin cost before booking breakage as revenue.
Five failure modes that erase the lift
Every failed cashless rollout fails in one of five ordinary ways. None are chip problems; all are operations problems you can contract and rehearse away.
- Top-up network outage: if topping up requires connectivity and the site's carrier drops under 30,000 phones, spending stops. Require offline-mode top-up (cached balances, post-event settlement) in writing.
- Unspent-balance refund obligations: check platform rules and local law BEFORE promoting 'load $50' - forced refunds convert breakage windfall into an admin liability.
- Staff prompting scripts: cashless shifts behavior only if staff steer people to taps; a 20-minute briefing per bar team is the highest-ROI line item in the program.
- Band delivery lead time: custom-printed wristbands run 10-14 working days production plus shipping from Shenzhen - order after the poster art locks, not after the tickets sell.
- Chip and format mismatch with the platform: closed-loop systems certify specific chip families and form factors - confirm the platform's approved-band list before ordering pretty ones.
Measuring the lift so it survives scrutiny
Without a measurement framework, RFID revenue claims stay marketing fluff. Capture these five metrics before and after deployment.
| Metric | How to capture | Typical RFID effect |
|---|---|---|
| Per-attendee average spend | total cashless transactions / unique attendees | lifts into the benchmarked 15-30% band |
| Transactions per attendee | unique transactions / attendees | 1.5-2x - impulse frequency, not bigger baskets |
| Peak queue time | timed observation at the main bar, same hour both years | falls from tens of seconds to single-digit taps |
| Vendor revenue distribution | platform dashboard, live | underperformers visible within hours, not at teardown |
| Breakage rate | unredeemed credits / loaded credits | 5-15%; watch it normalize after year one |
Useful next pages
Use these linked product, guide and comparison pages to keep the next click specific and practical.
Event RFID wristband products
Cashless-enabled wristbands for festivals, concerts and events.
Industry data references
Public vendor and analyst sources buyers can cite when defending the cashless RFID business case.
FAQ
How much more do attendees spend with RFID cashless wristbands?
Industry data from hundreds of RFID-enabled events shows a consistent 15-30% increase in per-attendee spending compared to cash-only or card-only environments. The increase is driven by faster transactions, reduced queue abandonment, and the psychological ease of tap-to-pay. Multi-day festivals at the higher end report up to 30% uplift, while single-day events typically see 15-20% gains.
What is the cost of implementing RFID cashless for an event?
RFID cashless wristbands cost $0.50-1.50 per band depending on material (fabric, silicone, Tyvek) and chip type. Point-of-sale terminals cost $200-500 per unit for rental or $500-1,500 for purchase. The cashless platform software is typically provided by a cashless vendor on a per-transaction fee basis (1.5-3% of transaction value). For a 5,000-attendee event, total implementation cost is typically $5,000-15,000.
Do attendees prefer RFID cashless or do they want cash options?
Attendee acceptance of RFID cashless has increased significantly, with most events reporting 80-90% satisfaction rates. Younger demographics (18-35) show the highest preference for cashless. Best practice is to offer an RFID cashless option alongside limited cash top-up stations for attendees who prefer not to link payment cards, ensuring accessibility while maximizing the cashless revenue benefits.
How long until I see payback on the RFID cashless investment?
Industry case data published by Glownet, Tappit and RFIDhy points at 12-18 month payback for festival-scale deployments. The composition: roughly 50-60% of the payback comes from incremental F&B revenue (the 15-30% per-cap lift), 20-30% from cash-handling labor and shrinkage savings, 10-20% from new sponsor-funded payment inventory, and the balance from chargeback reduction. Single-day events typically see payback within the first event; multi-day festivals within their first or second season.
What's the breakage rate on unused RFID credits?
Industry observation puts unredeemed credit at 5-15% of total pre-loaded value at end of event. After refund processing (most platforms run a 24-48 hour refund window starting same-night-as-event), the net retained breakage typically settles at 1-3% of total preload. Treat this as a planning number, not a target — events that aggressively block refunds to maximize breakage generate negative press that erodes attendee trust the next year.
Sources & references
Primary standards, OEM datasheets and regulatory documents cited by this article. All URLs were verified on the access date shown below.
- Intellitix - The Real Value of RFID
Source of the 15-30% per-capita spending increase benchmark
- Glownet - Why cashless payments are the future of events
Up to 30% higher revenue per guest across festival deployments
- Tappit - RFID benefits for events
22% average increase in event takings after cashless rollout
- Weezevent - Lakefest case study
UK festival cashless deployment outcome reference
Proud Tek is a Shenzhen-based RFID & NFC manufacturer supplying hotel chains, transit operators, event venues and retail brands worldwide. Every order includes free samples, RF testing and dedicated project support.
Get a Quick Quote
Tell us about your project and we'll respond within one business day. Fields marked (asterisk) are required.